
Observability & Alerting Platform
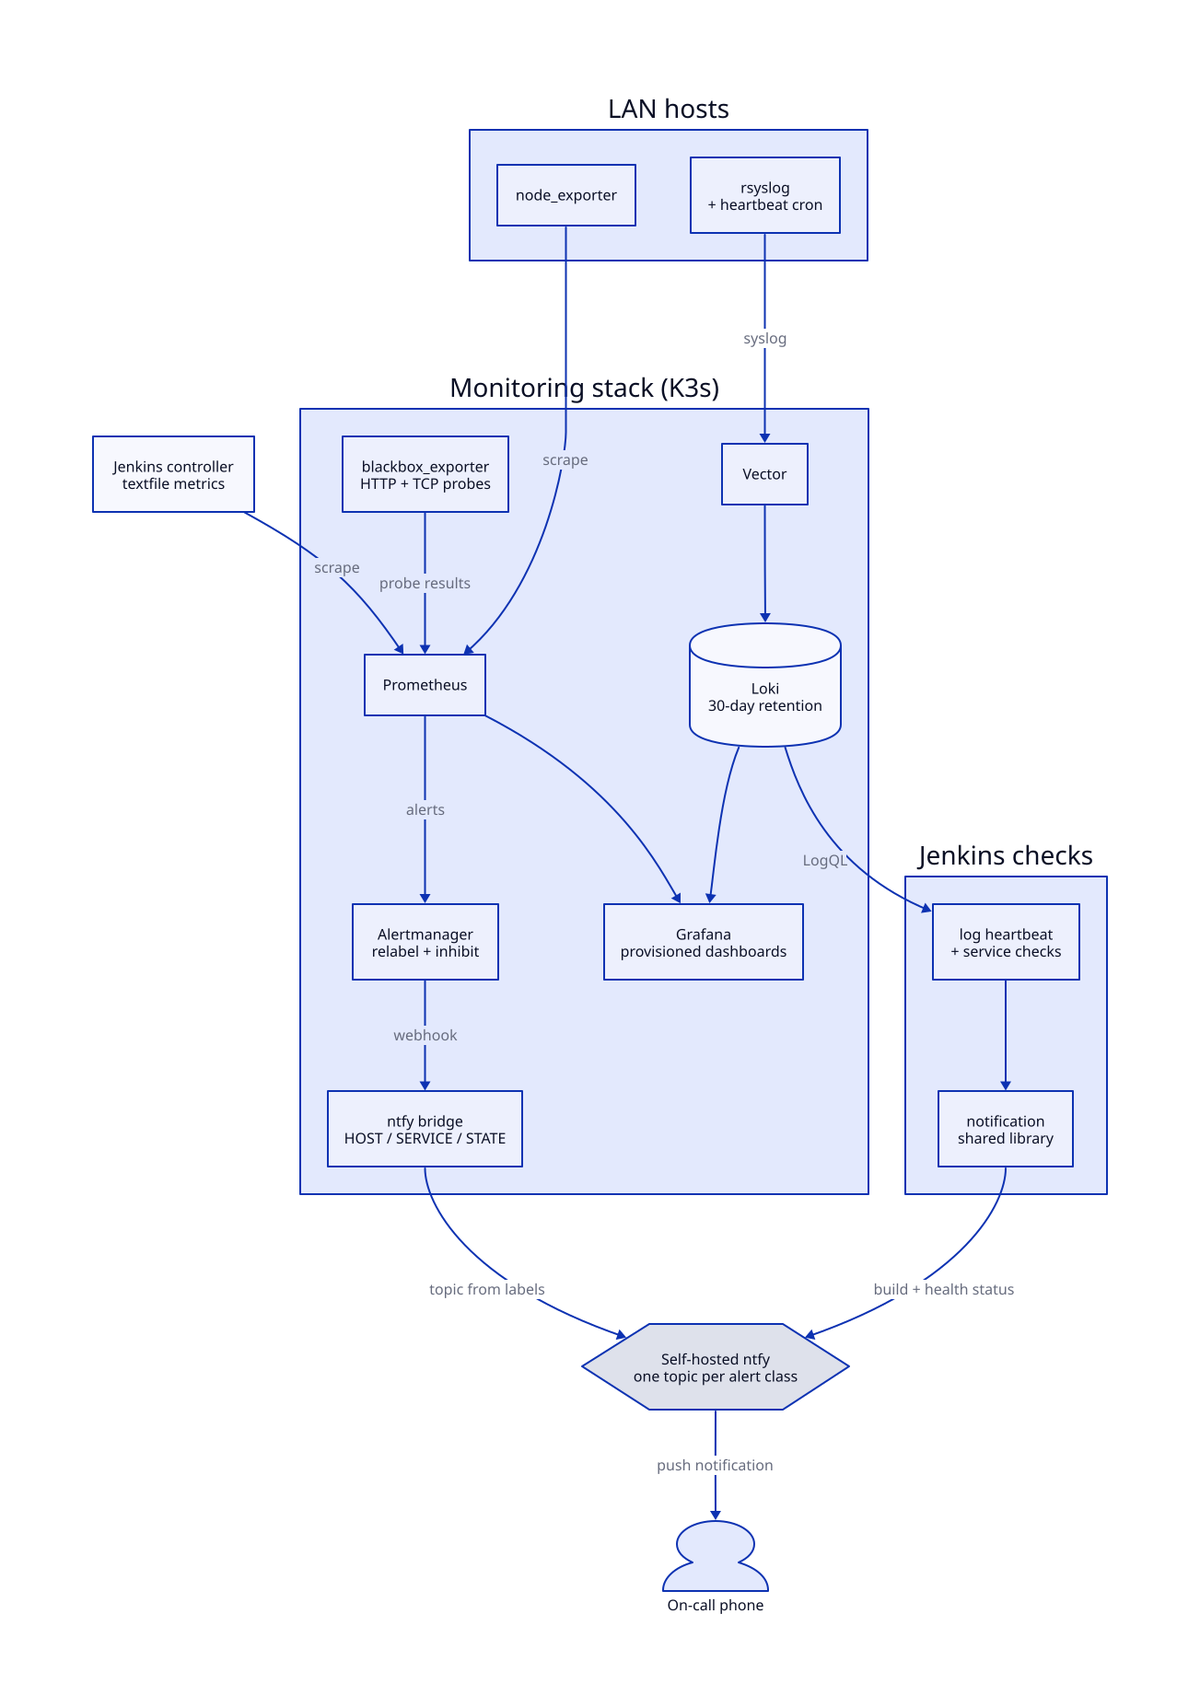
Metrics, logs and build status travel separate paths but all arrive on the phone through topic-routed ntfy notifications.
The Challenge
A lab spanning several Kubernetes clusters, a NAS and more than a dozen hosts had no single view of its health, and early notifications were more noise than signal. Alerts arrived on the phone carrying a dozen raw Prometheus labels, a single host outage produced a separate page for every disk, endpoint and service on it, and bundled severities said little about urgency. One notification flood turned out not to come from Prometheus at all: two frequent Jenkins health checks had queued up behind blocked agents and then fired all at once.
Logging had its own false positives. A liveness check that asked whether a host had sent any syslog recently kept flagging quiet hosts that were perfectly healthy.
The Solution
The platform has three layers that share one destination. Metrics come from kube-prometheus-stack scraping node_exporter on every host plus blackbox HTTP and TCP probes. Logs flow from rsyslog on every host through Vector into Loki, with a deterministic once-a-minute heartbeat as the liveness signal. Build and service status is published by Jenkins jobs through a shared notification library. All three deliver to a self-hosted ntfy server, one topic per alert class, so each class can be muted independently.
Notifications were redesigned in a classic Nagios style, with a [CRIT] host · service title and a fixed HOST / SERVICE / STATE / CHECK body. Alert relabeling guarantees every alert names a host and a service, and Alertmanager inhibition turns a host outage into a single "host down" page. Jenkins checks gained hysteresis and non-overlapping schedules, and trend-projection alerts were replaced with actionable thresholds.
Implementation Details
Everything is code, deployed through the Jenkins-driven Ansible job: Helm values, PrometheusRule and Probe resources, exporter roles and the notification bridge.
- Alert rules: custom host, synthetic and CI rules, each carrying host, service, topic and severity labels. Alert relabeling fills in defaults and strips the internal labels that used to clutter notifications.
- Inhibition: a host-down alert suppresses everything else on that host, endpoint-down suppresses endpoint-slow, and critical suppresses warning. Null routes absorb heartbeat alerts and duplicates.
- Notification bridge: routes each alert to its ntfy topic from its labels, maps severity to phone priority, and renders explicit RECOVERED notices. Configuration changes trigger an automatic restart because the bridge reads its configuration only at startup.
- Synthetic checks: 19 blackbox probes cover public and internal HTTP endpoints and TCP services, including certificate-expiry alerts.
- CI health: a textfile collector on the Jenkins controller publishes agent, queue and stuck-build metrics every minute, so alerts keep working even when every build agent is offline. A staleness alert covers the collector itself.
- Log liveness: Loki keeps 30 days of logs from all clusters. A per-minute heartbeat on every host, plus a write-then-read round trip, feeds a Jenkins check with three-strike hysteresis.
- Service checks: a checker covering HTTP, TCP, DNS and audio-stream services pages only after repeated failures and pings an external dead-man's switch, so a stalled checker is caught out of band.
- Operations: a runbook documents every alert's meaning and remediation, what is intentionally not paged, silencing recipes and a host decommission checklist. Provisioned Grafana dashboards sit over both Prometheus and Loki.